What is exhibition area heat analysis?How dwell heat maps quantify booth attractiveness
Exhibition organizers often encounter an awkward situation: a booth has a constant stream of visitors, but the sales team says, "The people coming by aren't interested."Another booth looks quiet, yet quietly closes several deals. The problem is thatfoot traffic counting can only tell you "how many people passed by," but cannot answer "which locations truly retained people."Dwell heat maps fill exactly this gap.
From manual observation to data quantification: what problems do dwell heat maps solve?
The traditional approach is to have someone stand in a corner of the exhibition area and use paper and pen to record 'which time periods have more people, and which booths have people stopping by.' The limitations of manual observation are obvious: if you watch Zone A, you miss Zone B, and you cannot distinguish the essential difference between 'glancing while passing by' and 'stopping to ask questions.'
The dwell heat map turns 'staying' into quantifiable data—it doesn't count heads, but recordsthe duration and location distribution of each person's stay in a certain area, ultimately generating a visual heat map: red areas represent long dwell times and high attention, while blue areas represent quick pass-throughs. For booth operators, this map directly points to three decision points:
- Layout optimization: which booth positions naturally retain visitors, and which positions need to add interactive elements;
- Activity effectiveness evaluation: Whether stage activities and product demonstrations actually extend audience dwell time;
- Traffic flow adjustment: Which aisles cause congestion due to audience lingering, and which areas are completely ignored.
What is the difference between area attention and footfall counting?
The two address different dimensions. Footfall counting answers 'how many people', while area attention answers 'what people are interested in'. A booth may have high footfall, but visitors may just be passing through.Another booth had fewer visitors, but each person stayed for an average of 5 minutes; the latter represents truly high-intent contacts.
The combination of area attention and dwell heat maps essentially measures 'traffic' and 'quality' separately. Visitor counting is the top of the funnel, while dwell heat is the conversion signal in the middle of the funnel.Without dwell data, you can only know how many times the booth was 'seen', but not whether it 'impressed' people.
How HooViz 2D AI Visitor Counting Camera Generates Area Attention and Dwell Heat Data
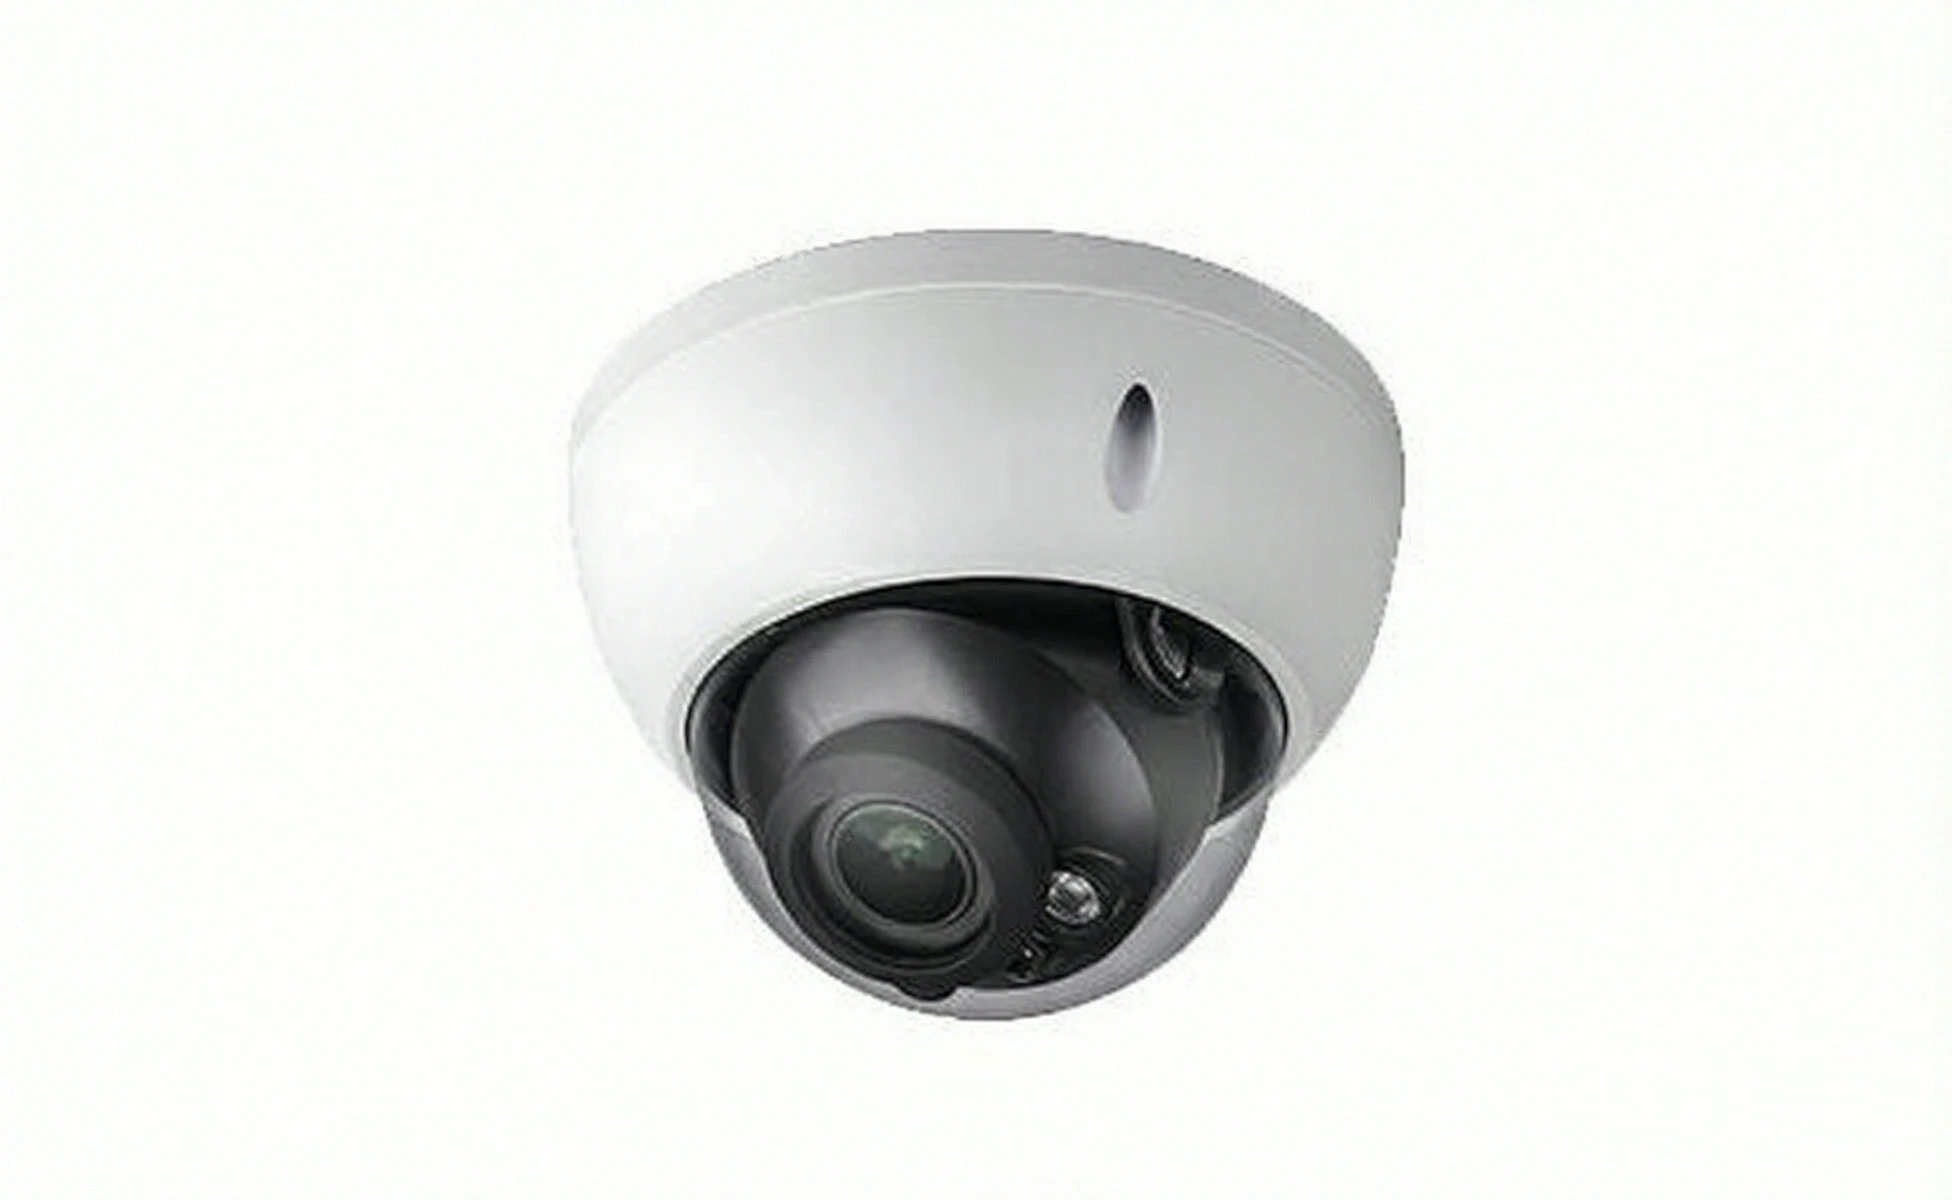
The HooViz 2D AI economical visitor counting camera adopts embedded ceiling mounting, and through built-in pedestrian detection and tracking algorithms, it records the movement trajectory of each person entering the frame in real time. It does not rely on cloud processing; 2.0 TOPS edge AI computing power completes recognition locally on the device, which meansDwell data is generated in real time, without the latency and privacy risks associated with video uploads.。
The specific workflow is: the camera continuously tracks the position coordinates of each pedestrian, and the system counts the personnel distribution density and average dwell time in each area at set time intervals (e.g., every 30 seconds), then overlays to generate a heat map layer. You can think of it asinstalling a tireless observer for each booth, which not only sees "who came" but also records "who stayed, how long they stayed, and where they lingered."
It should be noted that generating the dwell heat map requires confirming with the HooViz team in advance the division method of the exhibition area (by booth boundaries or by grid zones) and the threshold for determining dwell time (e.g., whether a stay of more than 10 seconds or 30 seconds counts as a dwell), as these parameters directly affect the interpretation of the heat map. If you already have preliminary ideas about the exhibition layout and the desired data dimensions, you can directly provide the floor plan to the HooViz team to confirm whether the camera installation height and focal length selection match your exhibition area.
How exhibition organizers use dwell heat maps to optimize booth layout and event planning
During the post-exhibition review, the biggest problem organizers face is often not "how many people came," but "where exactly did people stop and for how long." The dwell heat map turns this issue from an empirical judgment into quantifiable data, but the premise is knowing how to convert the data into actions.
Identifying Popular Booths and Cold Zones: A Data-Driven Approach to Layout Adjustment
The traditional approach is to rely on walking around after the show opens to feel where the crowds are, or to use booth sales data to infer the value of locations. The dwell heat map provides a more direct dimension: the average duration of visitors' stops in front of a booth and the cumulative number of stops. Combining these two can distinguish two types of "heat"—booths with high foot traffic but short dwell times,andbooths with moderate foot traffic but extremely long dwell times.of the booth.
The former indicates that the booth's visual appeal is sufficient but the content fails to retain visitors, while the latter suggests that the content is solid but the location lacks exposure.
The specific operation is divided into three steps:
- Divide heat zones by exhibition area: Rank the average dwell time per booth in descending order, taking the top 20% as hot zones, the bottom 20% as cold zones, and the middle as normal zones.Note that you should use the ratio of "dwell time / foot traffic" rather than the total alone, otherwise large booths will naturally have an advantage.
- Compare with the booth map to find patterns: Mark the hot and cold zones on the floor plan to see if there are structural factors—are booths near entrances, exits, food courts, or rest areas generally hotter?Is the cold zone concentrated at the end of a dead-end aisle or at the end of a one-way traffic flow?
- Adjust the layout for the next edition: In cold zones, prioritize placing major brands with their own traffic or interactive activity areas; in hot zones, you can appropriately raise prices or allocate space to sponsors in need of exposure.If the cold zone is caused by the end of the traffic flow, consider adjusting the aisle direction or setting up check-in points and rest stations in that area.
From dwell time data to event planning: which activities truly retained visitors
A common mistake in event planning is only counting the "number of participants," but a high participation count might just mean people passed by and grabbed a free gift, not that the event itself was attractive. What the dwell time heatmap can tell you is: whether the dwell time curve in that area shows a significant rise before and after the event starts, and whether the audience disperses quickly after the event ends or continues to stay.
The judging criteria are simple:If the peak dwell time in the area during the event is more than 50% higher than during non-event periods, and it declines slowly after the event ends, it indicates that the event content itself is engaging;If the peak is not obvious or drops sharply after the event ends, it means the audience was only attracted by sound or giveaways, and the event content did not retain people.
Adjustments that can be made based on this include:
- Retain and increase investmentin event types that significantly boost dwell time, such as live demonstrations and interactive experiences.
- Revamp or cutactivities that only cause momentary gathering but cannot extend dwell time, such as pure giveaway activities.
- Stagger scheduling: Schedule high-attraction activities in cold zones or off-peak periods, using activities to drive traffic to cold zones rather than concentrating near popular booths and exacerbating congestion.
Will equipment installation affect booth design?
This is the most frequently asked question when organizers push exhibitors to cooperate. The HooViz 2D AI economy passenger flow camera adopts embedded ceiling mounting, and the device itself is small, so its impact on booth ceiling decoration can be minimized. However, two conditions need to be confirmed in advance: first, whether there is stable power supply above the booth (supporting both DC12V and PoE; PoE can supply power via network cable, making wiring simpler);Second, whether the installation height and angle are within the device's detection range, which depends on the actual booth ceiling height and coverage area size.
It is recommended that organizers mark recommended installation points on the booth floor plan in advance and inform exhibitors of device dimensions and power requirements, so that interfaces can be reserved during the decoration design phase to avoid rework later. To determine whether the installation plan for a specific booth is feasible, the booth ceiling height, coverage width, and ceiling structure need to be provided, and then the HooViz team will confirm the matching plan.
Deploying 2D AI People Counting Cameras at Exhibition Scenes: Key Points for Installation, Power Supply, and Data Integration
Exhibition setup time is usually measured in hours, and any equipment that requires drilling, cabling, or additional debugging becomes a shared burden for both organizers and exhibitors. This section directly addresses four practical questions: whether installation will damage the booth, how to connect power, how data enters existing systems, and whether it still works when the network is disconnected.
Quick Installation for Temporary Setups: Embedded Design and Dual Power Supply Solutions
Will installation damage the booth decoration? This camera adopts an embedded ceiling-mounted design, with the body flush against the ceiling, requiring no exposed brackets or additional reinforcement structures. For standard booths, the installation process is essentially 'place and secure,' without damaging the original decorative surface.
However, one prerequisite must be noted:Ceiling mounting requires space above the ceiling for cable routing.If it is a closed ceiling booth where holes cannot be drilled for cabling, the cable path needs to be confirmed in advance; otherwise, the installation itself will not damage the decoration, but threading the cable may require a small opening at a corner.
How to solve the power supply problem at the exhibition site? This is the most practical pain point in exhibition deployment. Power distribution for booths is usually provided uniformly by the venue. Adding equipment temporarily often faces the problem of distant outlets and inconvenient power access.
This camera supports dual power supply via DC12V and PoE, meaning you don't need to find a separate power outlet in the booth—as long as the switch supports PoE, a single network cable handles both power and data transmission. For temporary booths, PoE power supply is the most convenient solution and also reduces the safety hazards caused by extension cords on site.
How to integrate data into existing systems: ONVIF/RTSP standard protocol integration
Can the data be integrated with the existing people counting platform? Yes. The camera supports ONVIF and RTSP standard protocols, which are de facto standards in the security and video streaming fields.
If your existing people counting analysis platform or video management system supports standard protocol integration, you can directly pull video streams or people counting data without developing a separate interface for this device. But there is a key point that needs to be confirmed with the current website team:Does your platform directly consume RTSP video streams for analysis, or does it require the device to actively push structured people counting data? The technical paths for the two integration methods are different. Only after confirming this can we determine whether it is 'plug and play' or requires a layer of data forwarding configuration.
Can it be used without internet connection? It works. The camera has built-in 2.0 TOPS of on-device AI computing power, and pedestrian detection, tracking, and trajectory analysis are all completed locally on the device, without requiring cloud involvement.
This means that even if the network at the exhibition site is unstable or completely disconnected, the camera can still complete foot traffic statistics and zone heat analysis. Data is first stored locally (starting from 8GB eMMC, with optional expansion), and can be exported or synced after the network is restored. For scenarios like exhibitions where the network environment is uncontrollable, this capability is a practical guarantee, not just marketing talk.
Next steps to confirm: Before deciding on deployment, provide three pieces of information to the current website team: the booth ceiling structure (whether cabling is possible), the on-site network topology (whether there is a PoE switch), and the integration method of your existing foot traffic platform (whether it supports ONVIF/RTSP streaming). Once these three items are confirmed, the deployment plan can be specified to the level of 'which specific booth, which power supply method, and which data path'.
How to choose a zone heat analysis solution for exhibitions?In which cases is it not recommended to use
The core of exhibition area heat analysis is not about "how expensive the equipment is," but "what decisions you need to make after obtaining the data." First, clarify this question, then discuss 2D, 3D, or manual observation.
2D AI Solution vs 3D ToF vs Manual Observation: Choose Based on Needs
| Solution | Questions It Can Answer | Cost Range | Main Limitations |
| 2D AI (such as HooViz 2D AI economical passenger flow camera) | Which exhibition area has longer dwell time, what is the movement path, and which time periods have more people | Low hardware cost, edge-side inference with no cloud fees | Cannot distinguish height/shelf levels, accuracy decreases in dense crowds |
| 3D ToF | Need to distinguish shelf layer heights and accurately count dense crowds in small areas | Significantly higher hardware cost | Strict installation height and angle requirements, complex debugging |
| Manual observation | Qualitative judgment of "which area looks lively" | Labor cost, no hardware investment | Cannot quantify, cannot trace back, prone to fatigue and omissions |
Conclusion: If your core need is to "quantify booth attractiveness, compare performance across areas, and optimize the next layout," 2D AI is the most cost-effective starting point. 3D ToF is only worth the extra cost when you need to distinguish shelf heights or when crowds are extremely dense (e.g., more than 3-4 people per square meter). Manual observation is suitable for one-off, informal on-site impressions, but not for continuous comparison.
When is it not worth adding this analysis system?
In the following three situations, it is recommended not to buy it for now and spend the money elsewhere:
- You don't have a clear 'next action' yet.。For example, you just want to 'look at the data,' but you can't specify what to adjust after getting the heat map—is it changing the booth location? Changing the traffic flow? Or cutting out a certain step?Data collection without a decision action is likely to become a one-time report.
- The exhibition is a one-time, non-recurring event.。If it is only a single event, with the next one more than a year away, and there is no reusable booth layout, the value of this system will be greatly diminished.Only exhibitions with multiple consecutive events and iterable layouts are worth the investment.
- On-site conditions cannot meet basic installation requirements。The equipment requires ceiling mounting, power supply (DC12V or PoE), and network (RJ45).If the booth is temporarily constructed, cannot accommodate cabling, or lacks a network environment, installation costs and risks will offset the analytical value.
How to determine if you need zone heat analysis
Ask yourself three questions, and only consider it if all are "yes":
- Do I have multiple exhibition areas or booths that need horizontal comparison of performance?
- Am I willing to adjust the next layout or activity arrangement based on the data?
- Can I collect data from at least 2-3 consecutive exhibitions?
If all three answers are usually yes, the 2D AI economical solution is sufficient to get started. If the first answer is no (you have only one booth and no comparison needs), then the core value of this system cannot be utilized.
Key trade-offs: The boundary of 2D AI lies in "zone-level" heat analysis—it can tell you which area has longer dwell times and higher foot traffic, but it won't tell you what a specific person looked at or their facial expressions. If you need individual behavioral details, that is not within the scope of a footfall camera; you need to evaluate other solutions separately. The current HooViz 2D AI economical footfall camera supports entry/exit traffic, pass-by traffic, zone attention, and dwell heat maps, with multiple focal lengths available to adapt to different installation heights and coverage areas. For your specific booth size and installation conditions, it is recommended to provide the booth floor plan and installation height to the HooViz team to confirm focal length selection and coverage plan.
Frequently Asked Questions
Q1: How big is the accuracy gap between 2D AI and 3D ToF? Under normal exhibition crowd density (not crowded or pushed), the accuracy of 2D AI for area dwell time and entry/exit statistics is sufficient to support layout decisions. The advantage of 3D ToF is reflected in dense crowd counting and height dimension, but the cost is usually several times that of 2D solutions.
If your booth is not extremely crowded, the error of 2D will not change your decision direction.
Q2: The exhibition is only one day. Is it worth installing? For a single-day exhibition with no subsequent sessions, it is not recommended. One day of data can only be descriptive, not for comparison and iteration.
Only if the same booth layout will be reused for multiple shows is it worth installing.
Q3: Does the equipment need to be connected to the internet? The HooViz 2D AI economy people counter uses on-device inference (2.0 TOPS) and does not require cloud computing. However, data export and remote viewing require a network connection (RJ45).
If there is no network at the exhibition site, you need to confirm whether local storage with offline export is supported—for this, you should check with the HooViz team about the specific working mode you need.
Q4: Can it be installed in a temporary booth? It depends on whether there are power and network cabling conditions. The device is a recessed ceiling mount with a small footprint, but if the booth is a temporary structure with truss and banner fabric, you need to confirm the load-bearing and cabling plan.
It is recommended to send the on-site photos and structural drawings to the HooViz team in advance to assess installation feasibility.
Q5: What specific actions can the heat map data guide? The two most direct actions are: first, adjust the placement of items in the booth—expand areas with long dwell times and transform neglected areas into interactive points;second, adjust the event schedule—move key activities to historical peak traffic hours. If you do not plan to take any of these actions, then this system is an overinvestment for you.
Learn More
If you are preparing for your next exhibition and want to evaluate booth value with data rather than feelings, you can first send us the booth floor plan and installation conditions.The HooViz team will assist in confirming focal length selection, installation points, and data integration methods based on your exhibition area, ceiling height, and layout, so that the heat map truly serves your layout decisions.
Related Products:2D AI Economy Passenger Counting Camera